The Linear Regression Channel Indicator for MetaTrader 5 automatically plots regression channels on price charts, facilitating trend analysis without manual intervention.
💎source :
https://tradingfinder.com/products/indicators/mt5/linear-regression-channel-free-download/
💎free indicator download:
https://cdn.tradingfinder.com/file/43025/linear_regression_channel_mt5_by_tflab.zip
In bullish trends, the channel ascends (positive slope), while in bearish trends, it descends (negative slope). The upper channel line indicates overbought conditions, suitable for sell positions, whereas the lower line signifies oversold conditions, ideal for buy positions.
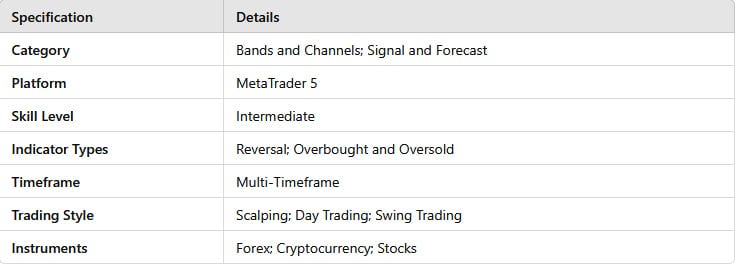
Indicator Specifications

🔹Overview
This indicator is a vital technical analysis tool for identifying trends and support and resistance levels. It renders bullish regression channels during upward trends and bearish regression channels during downward trends, streamlining the process of channel drawing.

💰Buy Signal Conditions
In a 4-hour EUR/CAD chart, when the price touches the lower regression channel line, it often acts as support, potentially leading to a bullish movement. Traders may consider entering long positions under these circumstances.
Take Profit and Stop Loss for Buy Positions
- Stop Loss: A few pips below the lower channel line.
- Take Profit: Near the upper channel line.
Sell Signal Conditions
In a 1-hour AUD/CAD chart, when the price reaches the upper regression channel line, it often serves as resistance, potentially initiating a bearish movement. Traders may consider entering short positions in such scenarios.
Take Profit and Stop Loss for Sell Positions
- Stop Loss: A few pips above the upper channel line.
- Take Profit: Near the lower channel line.
✏️Indicator Settings
- Channel Period: 150 candles
- Multiplier Bands: 1 (determines the distance of level 1 and 2 lines from the middle line)
Note: Users can customize line colors to match their chart preferences.

🔗How the Indicator Works
1. Bullish and Bearish Channels
- When the market is in an uptrend, the channel has a positive slope, indicating bullish momentum.
- In a downtrend, the channel slopes downward, signaling a bearish market.
2. Trading Signals
- Upper Channel Line → Represents overbought conditions, signaling a potential sell opportunity.
- Lower Channel Line → Represents oversold conditions, indicating a possible buy opportunity.
- Middle Line (Regression Line) → Acts as a dynamic support or resistance level.
3. Entry & Exit Strategies
- Buy Setup: Enter long positions when the price bounces from the lower channel line in an uptrend.
- Sell Setup: Open short positions when the price touches the upper channel line in a downtrend.
- Stop-Loss & Take-Profit: Stop-loss levels can be placed outside the channel, while take-profit targets can be set near the middle or opposite channel line.
🔍Summary
The Linear Regression Channel Indicator enhances trend identification by depicting price movements within dynamic channels. Trading in alignment with the prevailing trend can mitigate risks and improve success rates. For optimal results, it’s advisable to combine this indicator with other analytical tools, such as divergence analysis and classical chart patterns, to confirm trend directions.
FAQs
❓ Does the Linear Regression Channel differ from a moving average?
Yes, the Linear Regression Channel projects a trend based on statistical regression, while a moving average smooths past prices to show average price movement.
❓ How is the Linear Regression Channel Indicator calculated?
It uses linear regression to fit a best-fit line through price data, with parallel upper and lower bands set at a fixed standard deviation from the regression line.
Learn more Linear Regression Channel Indicator Download for MetaTrader 5 — Free — [Trading Finder]