
I know I know, historical data doesn’t predict the future, but if the pattern is significant it can give us a hell of an idea of what to expect.
Just want to present two pieces of data I found, that show US stocks are likely to continue rally into year end, and also be positive a year from now.
The first piece of data is the average returns of s&p 500 from 1950 – Now. It shows that stocks typically bottom on October 27 and rally towards end of year.
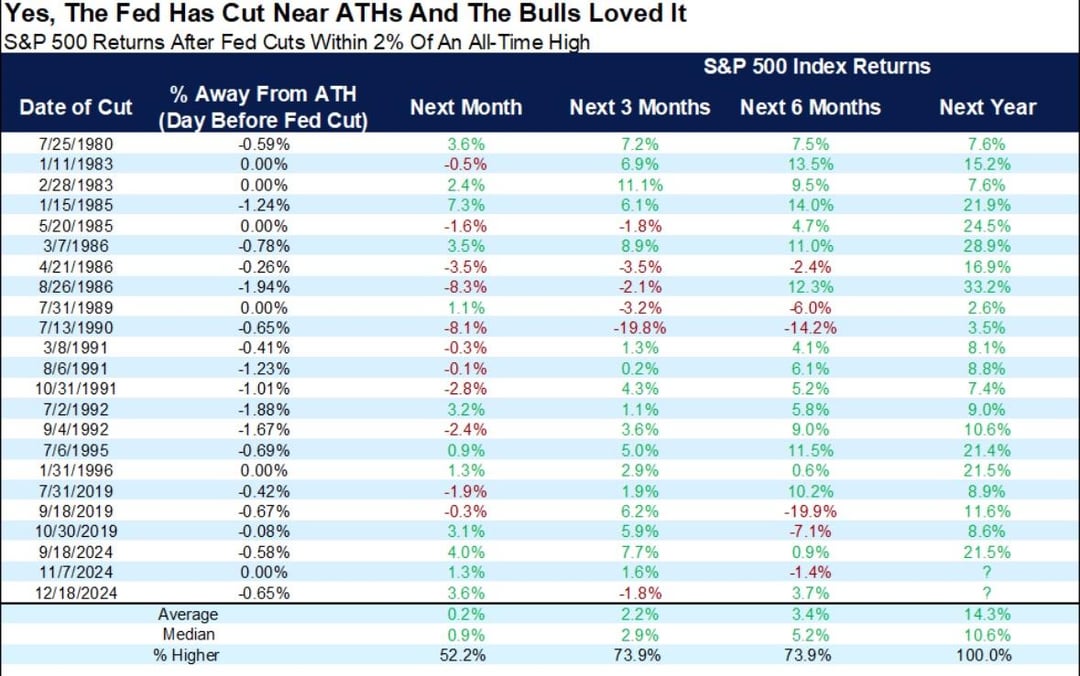
The second piece of data is the s&p performance a year from a rate cut. Out of 21 times the Fed has cut rates, if the s&p 500 was near 2% of ATH (likely to be the case on Wednesday) the s&p 500 was also positive a year later, 21/21 times.
Again, past doesn’t dictate future blah blah blah, but I like data 😁. I posted some positions that I’m flipping long the market, just so this post isn’t taken down.