The ACD Indicator, developed by Mark Fisher, is a technical analysis tool available for MetaTrader 5 (MT5). It is designed to identify daily price trends and can be utilized as a standalone trading strategy.
💎source :
https://tradingfinder.com/products/indicators/mt5/acd-free-download/
💎free indicator download:
https://cdn.tradingfinder.com/file/41587/acd-indicator-mt5-by-tflab.zip
This indicator is particularly effective in detecting daily price trends by defining the Opening Range (OR) during the first hour before major market sessions (Tokyo, London, New York) commence.
It subsequently displays the A up, A down, C up, and C down levels on the chart, assisting traders in making informed decisions based on price movements relative to these levels.
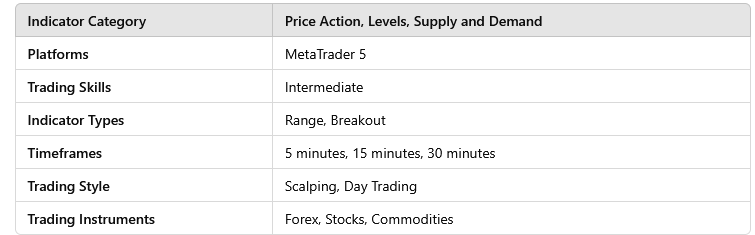
Indicator Overview

💰How the ACD Indicator Works
The ACD indicator operates by defining the Opening Range (OR) in the 1-hour timeframe before the opening of major markets (Tokyo, London, New York) and then displaying the levels (A up — A down) and (C up — C down) on the chart. Traders can make trading decisions based on price breaking through the (A up) and (A down) levels

Bullish Signal Conditions (Bullish Setup)
A bullish signal is identified when the price strongly breaks above the A up level and stabilizes above it for approximately 7 minutes. This stabilization helps prevent traders from falling into the trap of fake breakouts. Upon confirmation, traders may consider entering a buy trade.
Take Profit and Stop Loss for Buy Trades:
- Stop Loss: Set below the A down level.
- Take Profit: Utilize a reward-to-risk ratio of 1:1 to determine the take profit level.
🔺Bearish Signal Conditions (Bearish Setup)
A bearish signal occurs when the price strongly breaks below the A down level and stabilizes below it for approximately 7 minutes. This stabilization helps prevent traders from falling into the trap of fake breakouts. Upon confirmation, traders may consider entering a sell trade.

Take Profit and Stop Loss for Sell Trades:
- Stop Loss: Set above the A up level.
- Take Profit: Utilize a reward-to-risk ratio of 1:1 to determine the take profit level.
ACD Indicator Settings
The ACD Indicator offers customizable settings to tailor its application to specific trading preferences:
- ATR Period (Daily): Default value is 3.
- UTC Time (true) / Local Time (false): Set to TRUE to consider UTC time.
- Number of candles to display lines: Considers 1000 candles back for calculations.
- ShowBox: Set to True.
- Previous Candle for box (Daily): Considers the previous daily candle for calculations.
- ColorBox: OrangeRed color displayed on the chart.
- FillBox: Set to false for a hollow box.
- BoxStyle: Set to Dashdot.
- TokyoACD: Set to True.
- Tokyo Opening Range Time (minute): Consider High and Low in the first 45 minutes of the Tokyo session.
- Start Tokyo Time (HH): Start of the Tokyo session is at 00:00.
- End Tokyo Time (HH): End of the Tokyo session is at 06:00.
- A Level Multiplier (%): The percentage distance of the A lines is 5.
- C Level Multiplier (%): The percentage distance of the C lines is 8.
- Color of Tokyo Lines: Tokyo session color is blue or as desired.
- LondonACD: Set to True.
FAQS
❓Is the ACD Indicator applicable in all markets?
The ACD Indicator can be used in various markets, including forex, commodities, and stocks.
❓What are the benefits of using the ACD Indicator?
Practically speaking, the ACD Indicator serves as a specific trading strategy, equipping traders with reliable entry and exit points.
Learn more ACD Indicator for MetaTrader 5 — Free Download