The Daily High-Low Indicator is a valuable tool for traders using MetaTrader 5, designed to identify key support and resistance levels based on the highest and lowest prices recorded during a trading day.
💎source:
https://tradingfinder.com/products/indicators/mt5/daily-free-download/
💎free indicator download:https://cdn.tradingfinder.com/file/104379/dailyhl-mt5.zip
By marking these levels with distinct lines on the chart, the indicator aids in making informed trading decisions.
💰Key Features
- Indicator Category: Price Action — Support and Resistance — Levels
- Platforms: MetaTrader 5
- Trading Skills: Suitable for beginners
- Indicator Types: Trend, Reversal, Breakout
- Timeframe: Multi-timeframe
- Trading Style: Applicable to all styles
- Trading Instruments: Compatible with all markets

✏️Functionality Overview
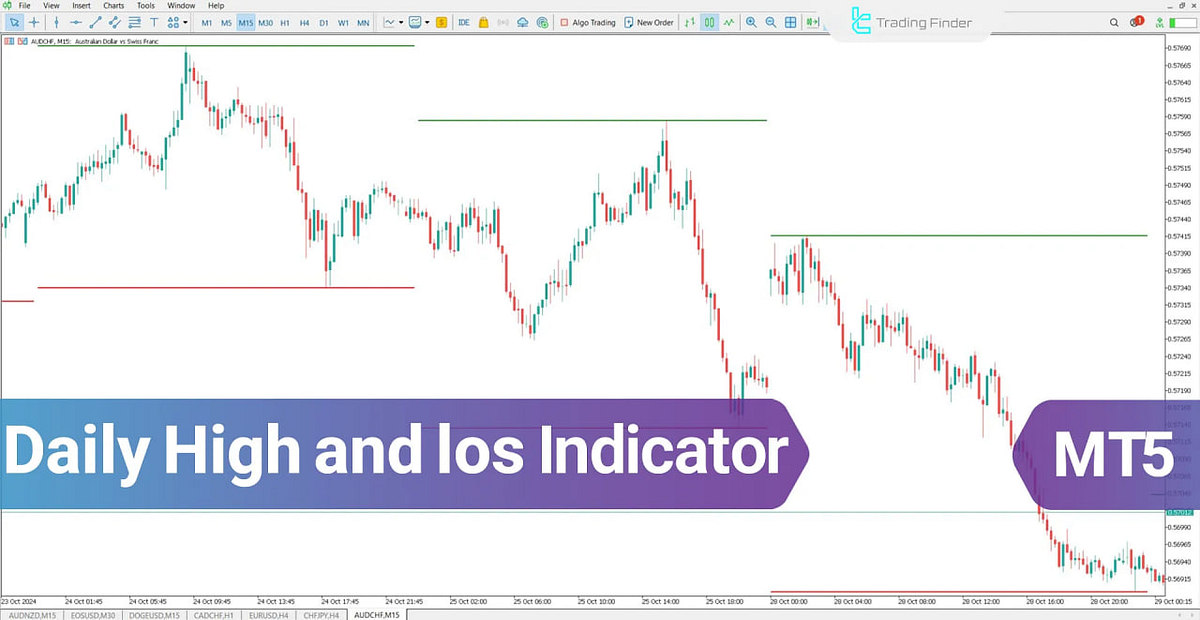
The Daily High-Low Indicator automatically plots the previous day’s high and low price levels on the chart:
- Previous Day’s High: Displayed as a green line
- Previous Day’s Low: Displayed as a red line
These levels serve as potential support and resistance zones, assisting traders in planning their trades effectively.
Trading Signals
Buy Signal Conditions (Support Level)
When the price approaches the previous day’s low, it may act as a support level. A bullish reaction at this level can be a signal to enter a buy trade. For instance, if the price of Silver (XAGUSD) reaches the prior day’s low and shows bullish candlestick patterns, it could indicate a buying opportunity.

Sell Signal Conditions (Resistance Level)
Conversely, when the price nears the previous day’s high, it may serve as a resistance level. A bearish reaction at this point can signal a sell opportunity. For example, if Brent Crude Oil (BRN) approaches the prior day’s high and exhibits bearish reversal patterns, traders might consider entering a sell trade.
🔗Indicator Settings
- Buy Color: Color for the highest price level (default: green)
- Sell Color: Color for the lowest price level (default: red)
These settings allow customization to match individual preferences.

Conclusion
The Daily High-Low Indicator is an essential tool for traders aiming to identify significant support and resistance levels based on daily price extremes. By integrating this indicator into their analysis, traders can enhance their decision-making process and improve trade accuracy.
FAQs
❓. What is the Daily High-Low Indicator?
The Daily High-Low Indicator for MetaTrader 5 is a trading tool that automatically plots the highest and lowest price levels of the previous trading day, helping traders identify key support and resistance zones.
❓. How does this indicator help in trading?
It assists traders by marking important price levels where potential reversals, breakouts, or trend continuations may occur. These levels can be used to refine entry and exit strategies.
❓. Is this indicator free to use?
Yes, the Daily High-Low Indicator is available for free download on Trading Finder.
Learn more Daily High-Low Indicator for MetaTrader 5 — Free Download