Dataset
This study is based on the post hoc retrospective analysis of stereoscopic 7-field CFPs obtained from eyes with DR in the RIDE (NCT00473382)33,34,35 and RISE (NCT00473330)33,34,35 phase 3 studies at baseline (start of the studies) that were not treated with anti-vascular endothelial growth factor (VEGF) therapy. RIDE and RISE were registered on 13/05/2007 with the title “A Study of Ranibizumab Injection in Subjects With Clinically Significant Macular Edema (ME) With Center Involvement Secondary to Diabetes Mellitus” and can be accessed via the ICTRP portal at the following URLs: RIDE at http://apps.who.int/trialsearch/Trial2.aspx?TrialID=NCT00473382, RISE at http://apps.who.int/trialsearch/Trial2.aspx?TrialID=NCT00473330.
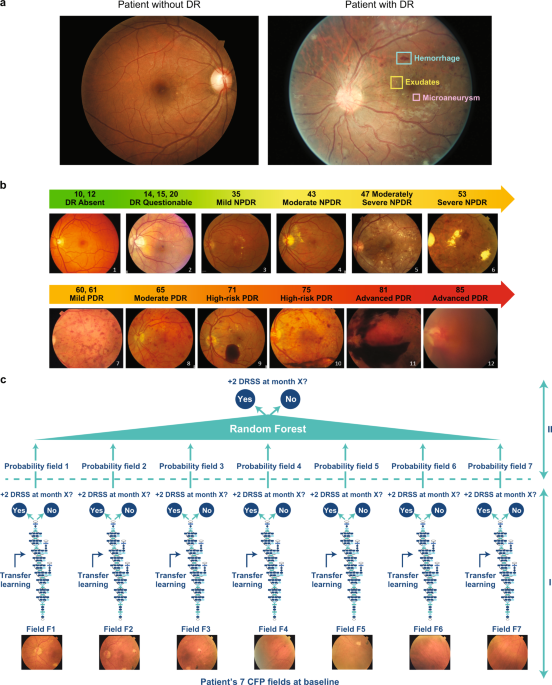
The objective of this analyses was to generate algorithms that can predict worsening in untreated eyes from baseline over a period of 2 years. From RIDE and RISE, only the baseline images from those eyes that were randomized to sham/untreated groups and the untreated fellow eyes were used for this work. These eyes had the natural course of DR worsening outcomes without anti-VEGF treatment collected at months 6, 12, and 24. There was a total of 529 (683 eyes, 4781 CFPs), 528 (682 eyes, 4774 CFPs), and 499 (645 eyes, 4515 CFPs) patients with untreated eyes who had all seven fields captured on CFP at months 6, 12, and 24. RIDE and RISE were two parallel, identically designed, phase 3, randomized, double-masked clinical trials of ranibizumab in patients with DR with diabetic macular edema. The studies were sham injection controlled for 2 years and followed for an additional year in which all sham patients crossed over to ranibizumab therapy. The study design, eligibility criteria, and core efficacy and safety outcomes of these trials have been previously described.32,33,34 Baseline ETDRS DRSS DR severity in RIDE/RISE sham-treated study and fellow eyes ranged from 10 (absent) to 71 (high-risk PDR) .20 The manually detected rates of two-step or more worsening in sham study eyes and fellow eyes at 2 years from baseline were 9.6% and 11.7%, respectively.33 The majority of the CFP images were of high quality due to the training requirement for all study site photographers who participated in CFP acquisition. Additionally, the image assessment for the manual severity grading was of the highest attainable quality because it was performed by two masked readers at an accredited fundus photograph reading center supervised by a senior reader in charge of adjudication when needed.
Each patient data point at each visit consists of seven CFP fields that span a 30-degree view of retina. The different fields are indicated with the following codes: F1 (optic nerve centered); F2 (fovea centered); and F3, F4, F5, F6, and F7 (all peripheral fields); all codes correspond to a general ETDRS standard adopted by reading centers.35
The trials adhered to the tenets of the Declaration of Helsinki and were Health Insurance Portability and Accountability Act compliant, and the protocols were approved by the study sites’ institutional review boards and ethics committees (or as applicable). Patients provided written informed consent.
Outcome variable for DR progression
The 7-field CFPs acquired for each patient at baseline were used to train DL models designed to predict, on an individual patient level, two-step or more worsening with respect to the ETDRS DRSS over 2 years, specifically after 6, 12, and 24 months. The problem under study is a binary classification, where ‘0’ means no occurrence of two-step or more ETDRS DRSS worsening at month X (6, 12, or 24), and ‘1’ means the opposite. The incidence of sham study and fellow eyes diagnosed with worsening by two or more ETDRS DRSS steps was ~6% at month 6, ~10% at month 12, and ~12% at month 24. The histograms in Supplementary Fig. 1 show the distribution of the population of sham study and fellow eyes at baseline with respect to the ETDRS DRSS overlaid with the number of DR progressors and non-progressors for month 6, 12, and 24.
The ETDRS DRSS scale has been validated and widely used for objective quantification of retinopathy severity in the clinical trial setting. The landmark trials, Diabetic Retinopathy Study and ETDRS, established that worsening of DR (that is measured by anatomic features on the ETDRS DRSS) is significantly associated with development of severe vision loss.36 Moreover, the incidence of clinically significant diabetic macular edema was shown to correlate with the progression of DR on the ETDRS DRSS from NPDR to PDR.20 Even just one-step or more DRSS worsening was shown to be associated with a five- to sixfold increased risk of PDR development, and a three- to fourfold risk of developing clinically significant macular edema with a high likelihood of vision loss over the period of 4 years.37 However, considering the intergrader variability associated with this scale, two steps or more on the ETDRS DRSS was deemed a more robust outcome variable to use for predictive modeling.
Modeling
The overall model is a binary classification whose input data points are sets of seven CFP images acquired for a selected eye at baseline. Modeling was performed in two steps: (1) DCNNs were separately trained for each type of CFP field to form the “pillars”; and (2) the probabilities provided by the individual pillars are then aggregated by means of RFs. Single pillars and RFs are trained against the binary outcome variable defined in the previous section. A simple schematic of the model is provided by Fig. 1c.
The Inception-v3 architecture38 was used to build the field-specific pillars. A transfer learning39 cascade strategy was adopted to create the starting weights; first, the architecture was initialized with Imagenet40 weights and trained on the Kaggle DR41 dataset to differentiate between CFPs with no DR from those with signs of DR; the weights generated by this last training are then used to initialize the training of the pillars for DR progression.
Transfer learning was performed, first by replacing and training for 10 epochs the last dense layers while keeping all the others fixed, and then by fine-tuning for 50 epochs all layers from the end up to the third one. The Adam optimizer was used with learning rates adapted for the various pillars. A small parameter grid search was conducted to find the optimal learning rates for the pillars. A five-times fivefold CV scheme with patient ID constraint (data points of the eyes of the same patient were constrained to belong to the same CV fold; i.e., both either to the training or testing set) was adopted to generate a total of 25 DCNNs for each pillar.
RFs42 were then used to aggregate the probabilities of all pillars. A five-fold CV scheme with the same folds of the previous step was performed. This means that for each fold, 35 probabilities (seven fields × five repetitions for each CV fold) were used as input features for the RF. Please see Supplementary Methods for additional information about the RF models used in this study.
The model performance was measured in terms of AUC, sensitivity, and specificity evaluated at the Youden’s point,43 which is obtained by maximizing the difference between the true- and false-positive rate.
SHAP is a technique originally adopted in game theory to determine how much each player in a collaborative game has contributed to its success. In the ML context, each SHAP value measures how much each feature contributes to the target prediction, either in a positive or a negative way.21 The traditional feature importance algorithm is based on the Gini index highlights, which features are contributing the most to the prediction across the entire population44 and is known in literature to be characterized by multiple biases,45 preventing this algorithm to be reliable in many scenarios. Differently from the Gini index, SHAP offers a local perspective by informing on the most predictive features at the level of individual sample.21 In the plots of Fig. 3, each row corresponds to an input feature and each colored dot is a sample, whose color ranges from blue to red to inform whether the selected input feature has a low or a high value for the selected sample.
The attribution maps for the individual DL models presented in Fig. 4 were generated by means of a gradient-based technique called guided-backpropagation.46 The idea behind gradient-based methods is that the relative importance of the input features is measured by computing the gradient of the output decision with respect to those input features.47 This gradient, once back-projected onto the input image, provides an idea of where the CNN has focused on in order to classify the image in a certain way. In particular, guided-backpropagation46 is characterized by the suppression of flow of gradients where either the input or incoming gradients are negative.
Reporting summary
Further information on research design is available in the Nature Research Reporting Summary.