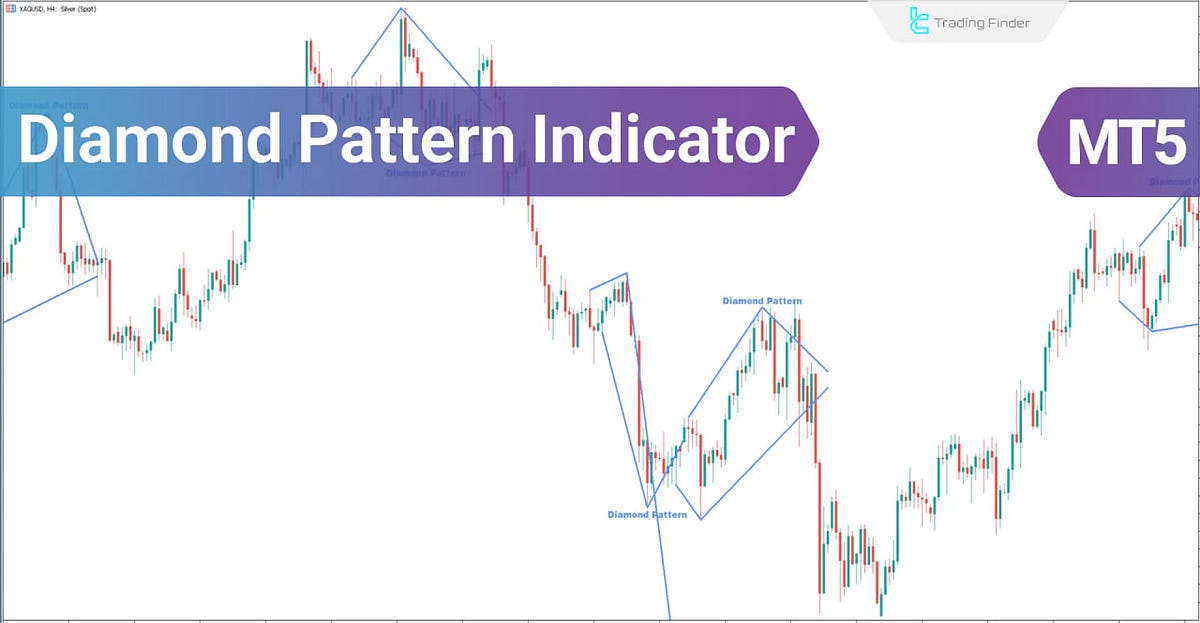
🔹The Diamond Pattern Indicator is a specialized tool for MetaTrader 5 designed to help traders identify diamond chart patterns. These patterns are reversal signals that often appear after prolonged uptrends or downtrends.
By identifying such formations, the indicator provides traders with insights into potential trend reversals, enhancing their ability to make informed trading decisions.
💎source:
https://tradingfinder.com/products/indicators/mt5/diamond-pattern-free-download/
free indicator download: https://cdn.tradingfinder.com/file/41586/diamond-pattern-mt5-by-tflab.zip

Key Features and Benefits
- Automatic Pattern Detection: Identifies diamond patterns without manual effort.
- Multi-Timeframe Analysis: Supports all timeframes, offering flexibility for day traders, swing traders, and scalpers.
- Versatile Usage: Suitable for Forex, stocks, commodities, and other financial instruments.
- Signal Accuracy: Works effectively when combined with support/resistance levels and other technical tools.
What Is the Diamond Pattern?
The diamond pattern is a reversal chart formation that indicates a potential shift in market direction. It typically forms during the late stages of a trend and signals a change in the prevailing price movement.
Why Use the Diamond Pattern?
- Trend Reversal Insights: Recognizes shifts from bullish to bearish trends (and vice versa).
- Improved Precision: Provides clear entry and exit points when coupled with risk management tools.
- Comprehensive Analysis: Works across various trading styles, including scalping and swing trading.
💵Buy Signal Conditions
In the USD/JPY 15-minute chart below, a Bullish Diamond Pattern is identified at the end of a downtrend, indicating a potential reversal to an uptrend. A buy signal is generated when the price breaks above the upper boundary of the diamond pattern.
Take Profit and Stop Loss Strategy:
- Stop Loss: Place below the pattern’s last low.
- Take Profit: Set equal to the depth of the diamond (the vertical distance between the highest and lowest points within the pattern).

Sell Signal Conditions
In the NZD/USD 1-hour chart below, a Bearish Diamond Pattern is identified at the end of an uptrend, suggesting a potential reversal to a downtrend. A sell signal is generated when the price breaks below the lower boundary of the diamond pattern.
💡Take Profit and Stop Loss Strategy:
- Stop Loss: Place above the pattern’s last high.
- Take Profit: Set equal to the depth of the diamond.
Diamond Pattern Settings
Zig Zag Line Properties:
- Show Zig Zag Line: Set to true to display the Zig Zag line.
- Pivot Period of Zig Zag Line: Typically set to 2.
- Zig Zag Line Style: Displayed as a dash-dot line.
- Zig Zag Line Color: Default is blue; customizable.
- Zig Zag Line Width: Set to 1

🔍Conclusion
The Diamond Pattern Indicator for MetaTrader 5 simplifies the process of identifying reversal patterns, helping traders anticipate trend changes with greater confidence. By integrating this indicator with other tools such as support/resistance levels and risk management strategies, traders can improve their decision-making and optimize their trading performance.
FAQs
❓How does the Diamond Pattern Indicator work?
The Diamond Pattern Indicator automatically detects diamond-shaped chart patterns to signal potential trend reversals.
❓How to enter a trade in the Diamond Pattern?
Enter a trade when the price breaks above (for bullish) or below (for bearish) the diamond’s boundary.
Learn more Diamond Pattern Indicator for MetaTrader5 Download — free — [TradingFinder]