How Public Data and Python Reveal the True Effects of Healthcare and Wage Reforms — Without a Lab
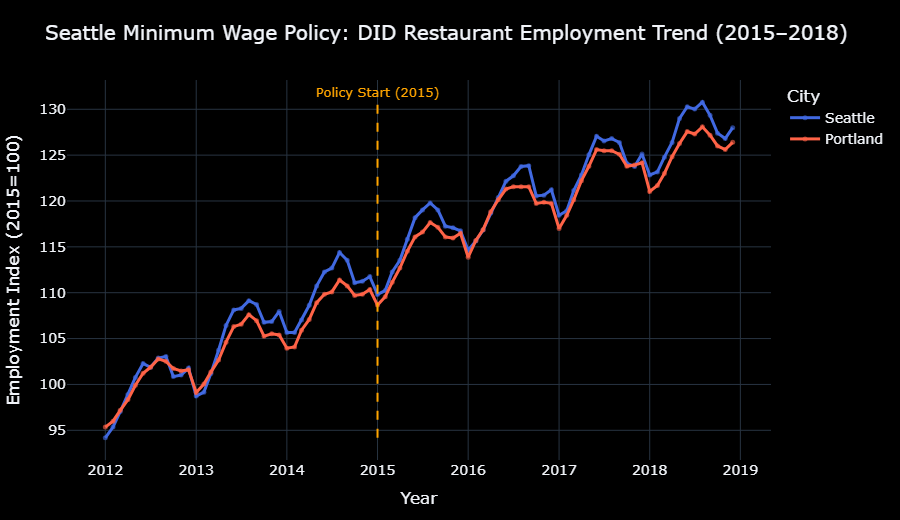
In 2015, Seattle became the first major U.S. city to raise its minimum wage to $15. Headlines warned of mass job loss. But what really happened? Let’s dive into the data and see what public evidence reveals.
1. Why Causality Matters More Than Ever
In a world overflowing with dashboards, it’s easy to spot what changed. But it’s harder — and far more important — to answer: why did it change?
Was it the new policy? A cultural shift? Or just noise in the numbers?
In the age of correlation, we crave causality. Not just to track trends, but to understand impact — and responsibility.
That’s where causal inference comes in. It’s not just a method. It’s how data becomes truth.
And in this article, we’ll show how anyone — with Python and real public data — can detect causal effects from real-world U.S. policies.
2. A Quick Primer on Causal Thinking
Here’s a simple cheat sheet for the four core methods analysts use:
