
This is from my blog so it might read odd as a reddit post, but I can’t be bothered to rewrite it.
The other posts I’ve made about eBay here
First: https://www.reddit.com/r/wallstreetbets/s/UzRzKsS5qj
Second: https://www.reddit.com/r/wallstreetbets/s/I83kPsYTtA
Third: you are here
Mega thesis: coming soon
——-
So, I'm driving to work and I decided I really wanted to see the numbers between the grift cycles of resellers/scalpers and collectors of different niches, I looked at graphics cards, Labubus, FunkoPops and Pokemon.
The results are actually incredible. I’m not going to make you read some insanely long blog post to get the information your here for. So with out further adieu; CHART
https://keystonequant.com/content/images/size/w1600/2025/10/B3C79070-6A77-4632-B294-80A2D04B71DB.png
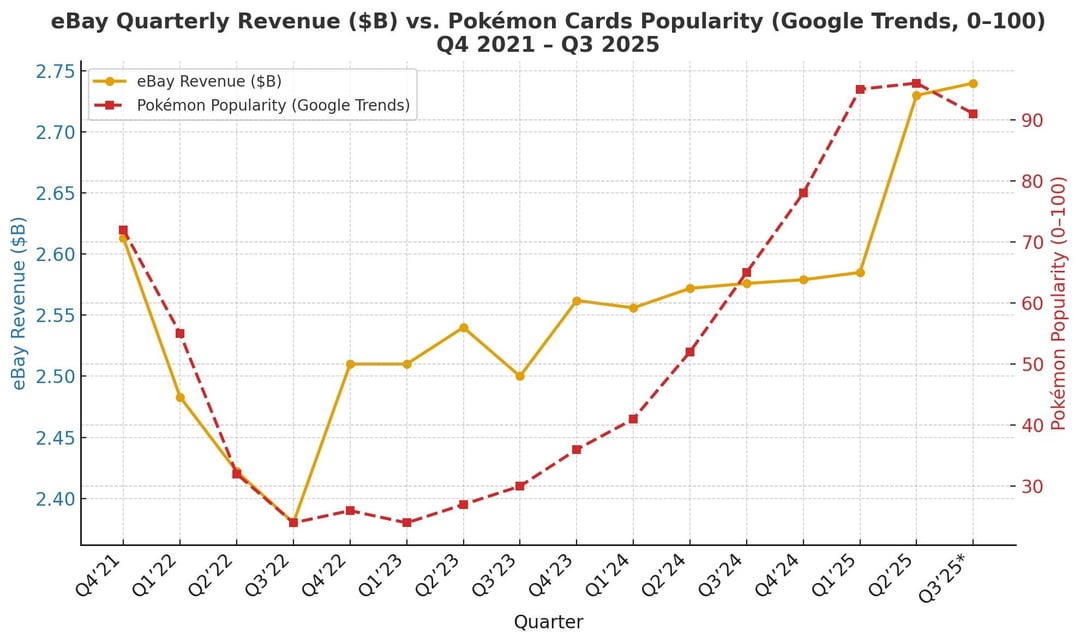
Pokemon popularity and eBay earnings
It’s pretty close right? When we look at that chart it almost seems like they match pretty well. But it gets magical when we shift the chart by two quarters.Pokemon popularity and eBay quarterly earnings, shift two quarters to the right
https://keystonequant.com/content/images/size/w1600/2025/10/IMG_9558.png
Running regression on this we get some really sexy results.
‘’’Lag-1 (Pokémon Q3'25=91 → Q4):
ebay = 2.457 + 0.0025 × 91 = $2.687B (R²=74%)
Lag-2 (Pokémon Q2'25=96 → Q4):
ebay = 2.463 + 0.0028 × 96 = $2.733B(R²=81%)
Ensemble: $2.710B | 95% CI: $2.68–2.74B
The model perfectly hit Q3 guidance ($2.69–2.74B → actual $2.73B Q2).’’’
Need Confirmation? The recent poke-boom = confirmation: Last 8Q (rising Pokémon era): Lag1/2 hit 89-90% correlation, 79-81% R² — Pokémon alone “causes/correlates to” ~80% of eBay’s 2025 revenue explosion (from $2.57B → $2.74B).
Bottom Line: Pokémon = eBay’s leading indicator with ~80%+ predictive power recently.