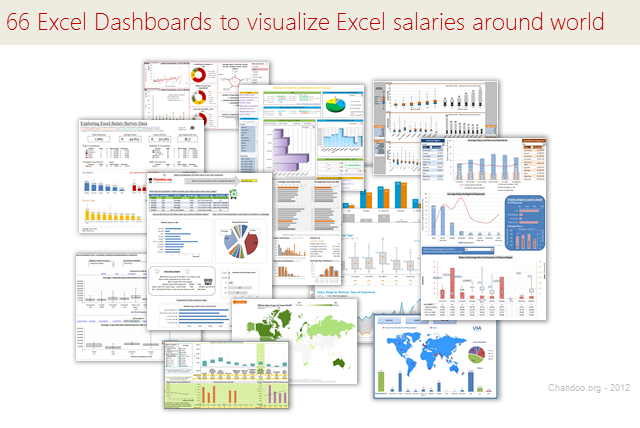

About a month ago, we announced our brand new contest – Visualize Excel Salary survey data here.
We received 66 outstanding entries for this. More than 40 entries are truly world-class with innovative visualizations, interactive graphs & kick-ass number crunching. It took me quite a while to organize all these entries, collect screenshots and review them.
So how do we make sense of all these?
Since doing justice all this variety and creativity in one post is difficult, I am splitting this in to 4 entries.
- All 66 Dashboard entries & my comments [this post]
- How to create Box plots?
- How to make your dashboards interactive?
- Voting for contest winner
How to read this post?
This is a fairly large post. If you are reading this in email or news-reader, it may not look properly. Click here to read it on chandoo.org.
- Each entry is shown in a box with the contestant’s name on top. Entries are shown in alphabetical order of contestant’s name.
- You can see a snapshot of the entry and more thumbnails below.
- The thumb-nails are click-able. So that you can enlarge and see the details.
- You can download the contest entry workbook, see & play with the files.
- You can read my comments at the bottom. If I liked a particular entry, I have put a small “Chandoo’s pick” icon too.
- At the very bottom of this page, I have put a list of resources to help you learn most of the techniques used by our participants.
Thank you
Thank you very much for all the participants in this contest. I have thoroughly enjoyed exploring your work & learned a lot from them. I am sure you had fun creating these too.
So go ahead and enjoy the entries.
Interactive Dashboard by Akash Khandelwal


Download workbook:
- Dynamic charts (with filter)
- 5 types of analysis
Interactive Dashboard by Aldo Mencaraglia


Download workbook:
- Dynamic charts
- Indexed salary analysis by country & position
Dashboard by Anchalee Phutest

Download workbook:
- Ability to select any of 6 analysis charts and view
- Word cloud from wordle.net
- World map with colors based on salary made
- Box plots
Learn how to make Excel Dashboards & Reports

- Learn how to create interactive dashboards & reports using Excel
- Analyze data like a pro
- 32 hours of video training
- Learn at your own pace
- Click here to know more

Interactive Dashboard by Bryan Waller


Download workbook:
- Dynamic charts
- Average vs. median salaries by region
- Box plots to compare any 2 roles
Interactive Dashboard by Dustin Corbin


Download workbook:
- Dynamic charts
- Good colors and layout
- Ability to compare any country / job type with world-wide averages


Dashboard by Jairaj Guhilot


Download workbook:
- Multiple selection and analysis
- In-cell charts
Dashboard by Jingyi Wei


Download workbook:
- World-map with average salary data
- Select analysis type to see the chart
Learn how to make Excel Dashboards & Reports
- Learn how to create interactive dashboards & reports using Excel
- Analyze data like a pro
- 32 hours of video training
- Learn at your own pace
- Click here to know more
Interactive Dashboard by Jose Eduardo Chamon – Claro Matriz –


Download workbook:
- Analysis by country and top 10 positions
- Dynamic charts
- 3D charts
Interactive Dashboard by Juwin


Download workbook:
- Dynamic charts
- Compare multiple countries with one another
- Analysis by many criteria (Sal vs. Jobs, Jobs vs. Experience etc.)
Dashboard by Krishnan A


Download workbook:
- Analysis in any currency
- Interesting insights from data
- Salaries indexed by PPP
Interactive Dashboard by Krishnasamy Mohan


Download workbook:
- Dynamic hyperlinks to show charts
- 3D Charts
Become Awesome in Excel & VBA – Create dashboards like these…

- Learn how to create interactive dashboards & reports using Excel
- Develop your own macros & VBA code
- 50+ hours of video training
- Learn at your own pace
- Click here to know more
Dashboard by Lynn Mar


Download workbook:
- Slicers
- Pivot charts
- Comprehensive analysis
Dashboard by Marko Markovic


Download workbook:
- Pivot charts
- Interesting colors & chart construction
- What-if kind of analysis
Interactive Dashboard by Mohd Mustafa


Download workbook:
- Analysis of total numbers (total salary by position etc.)
- Dynamic charts
- Usage of form controls
Dashboard by Nathan Gehman


Download workbook:
- Very good colors
- Box plots
- Salary vs. years of experience (with quartile spread to get a sense)
Dashboard by Neculae Valeriu


Download workbook:
- 3D charts
- Conditional formatting with pivots
Dashboard by Peter Damian

Download workbook:
- User forms and notes
- Scenario analysis (set conditions to see how people are paid)
- Clickable world-map with interactive analysis of Top 15 countries
- Data form to browse and query data
![]()
Interactive Dashboard by Peter Van Klinken

Download workbook:
- Slicers & form controls for dynamic selection
- Comprehensive analysis
- Good colors and layout
- Good mix of text, data and charts
- Clickable world-map
- Search your average worth
- Built-in help
Interactive Dashboard by Rajendra Joshi


Download workbook:
- Dynamic charts
- Text observations & analysis
- Pie chart
Interactive Dashboard by Ramzan Shaikh


Download workbook:
- Dynamic charts
- Ability to compare one country with another
- Ability to view any data point
Interactive Dashboard by Saurabh Sharma


Download workbook:
- Dynamic charts thru pivot tables
- 3D Charts
Interactive Dashboard by Shyeo


Download workbook:
- Dynamic charts
- Comprehensive analysis
Interactive Dashboard by Susan Christine Mcmanus


Download workbook:
- Dynamic charts
- Pivot charts
Interactive Dashboard by Vishwanath M.C


Download workbook:
- Dynamic charts
- Key messages on top
- Box plots
Interactive Dashboard by Yogesh Gupta


Download workbook:
- Dynamic charts and multiple selections
- Clickable cells (with VBA)
- Ability to view results in any currency
Interactive Dashboard by Prince Goyal


Download workbook:
- Dynamic charts
- A view of all data that meets given condition
Interactive Dashboard by Vinita Varier


Download workbook:
- Dynamic charts
- Word cloud from wordle.net
- Average vs. total salary earned by all people in a country
Become Awesome in Excel & VBA – Create dashboards like these…
- Learn how to create interactive dashboards & reports using Excel
- Develop your own macros & VBA code
- 50+ hours of video training
- Learn at your own pace
- Click here to know more
Tutorials & Examples to Make Excel Dashboards
How do you like these dashboards?
I found quite a few of these really impressive. But I want to hear from you.
What entries you liked most? Go ahead and share your views.