“Wait, there is no way the first digit is 1 thirty percent of the time… right?” That was my reaction when I first bumped into Benford’s Law — the quirky rule that says, in many real‑world datasets, the leading digit is 1 about 30.1% of the time, 2 about 17.6%, 3 about 12.5%, … and 9 only 4.6%.
If your intuition screams “Shouldn’t it be 10% each?” you are not alone. Mine did too. But then I thought about prices I see every day: so many things live in the 100‑yen, 200‑yen, 300‑yen ranges (and 1,000s, 2,000s, 3,000s…). That mental list already leans heavy on 1s, then 2s, then 3s.
What Benford’s Law Applies To (and What It Does Not)
Benford shows up when numbers span several orders of magnitude and are not artificially bounded: river lengths, mountain heights, populations — and yes, often financial figures. It is less reliable for human‑assigned IDs, exam scores, or anything with a tight fixed range. Prices are human‑set, sure, but markets are shaped by countless independent decisions — the proverbial “invisible hand.”
A neat intuition: if the world is roughly scale‑invariant and many quantities are distributed close to log‑uniform across powers of ten, then when you look at them on a regular (linear) scale, 1s lead more often than 9s. That is the heart of Benford.
A Quick Test on Japanese Stocks
Curious, I wrote a small script (with generous help from ChatGPT and Python) and ran it on all Tokyo Stock Exchange Prime listings for today’s close (2025‑10‑12 JST):
- Pull the latest JPX “listed issues” Excel, keep only Prime tickers.
- Fetch closing prices from Yahoo Finance.
- Extract the first significant digit (1–9).
- Compare the empirical distribution to Benford’s theoretical curve.
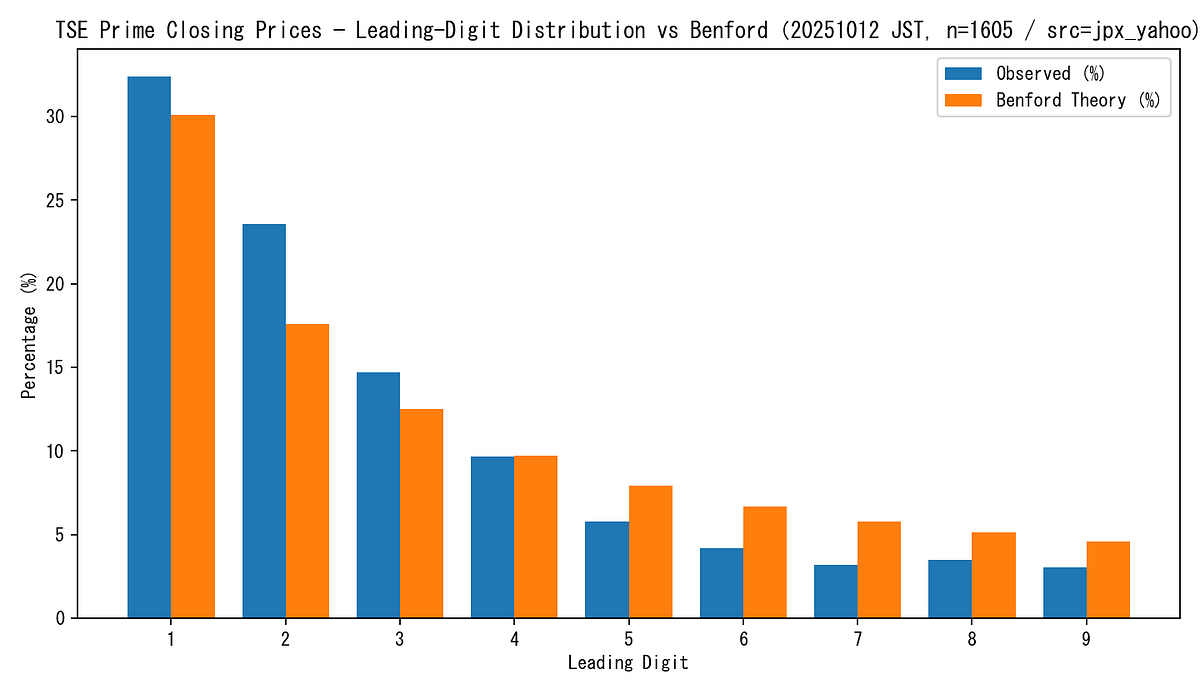
Here is the plot. Blue is empirical; orange is Benford’s theory. Sample size n = 1,605.

What the numbers say
- Chi‑square test: p‑value is tiny (i.e., we can detect a statistical difference with this large n).
- KL divergence: about 0.03 — small, meaning the two distributions are close in an information‑theoretic sense.
Both can be true: with large samples, even small deviations register as “statistically significant,” while distance measures like KL can still be small. Visually and practically, this looks remarkably Benford‑like.
Why this soothed my skeptical brain
At first, Benford feels like a party trick. But the log‑scale to linear‑scale story makes it click: many natural or economic processes multiply and scale; when you look at their magnitudes without logs, you naturally sample more numbers starting with 1, fewer with 9.
What Comes After
It is surprisingly easy to check things like this using ChatGPT and Python. In an age where we can instantly test scale-invariant laws or mathematical models that may apply to seemingly unrelated phenomena, it is impossible to predict what kind of class change the world will undergo next. But I, for one, intend to enjoy it.