Note: this post is part of a series of posts regarding HP3101 (Applied Statistical Methods for Psychological Research)
We’ve finally reached the last topic (yay!) of HP3101 — Crossover Design! 🎉
Being the topic taught on the final week (Week 13) of the course also meant I was already in ORD mode as I attended this lecture. Looking back at my notes, I can barely recall the logic behind some of the things I wrote.
I’ll be honest with you — I’m not going to teach the HP3101 course content in this post. While revising my old notes and checking other resources, I realised that Prof Ringo chose to teach a very specific type of Crossover Design (2×2). With this specificity, the ANOVA table could be simplified to reduce the number of rows.
Ironically, this simplification confused me even more. When I went back to my notes, it didn’t seem to line up with other online resources. Only after I understood the “full” crossover design logic was I able to make sense of the simplified version Prof Ringo was trying to teach.
The thing about higher-level courses in NTU Psychology is that they can sometimes feel too practical — Prof Ringo’s emphasis was on how to conduct a test, rather than why the test works. I don’t blame him, though. Looking back, I can see why he didn’t go into certain details: the rationale behind some tests truly requires a lot of background knowledge, and covering everything in 13 weeks is impossible.
The point is: you have to start somewhere. Prof Ringo chose to teach breadth — covering a variety of techniques and showing us how to use them — which was probably the best he could do within such a short period. Can you imagine if we spent 13 weeks on a single method (e.g., Dominance Analysis) and came out of HP3101 knowing only one single new technique?
Some things you only see clearer after you’ve graduated — the way professors design courses, the balancing act between breadth and depth, and the challenge of catering to a diverse group of students. (I’m pretty sure not many people are as interested in statistics as I am… oops.)
Anyway, let’s get to work!
What is Crossover Design?
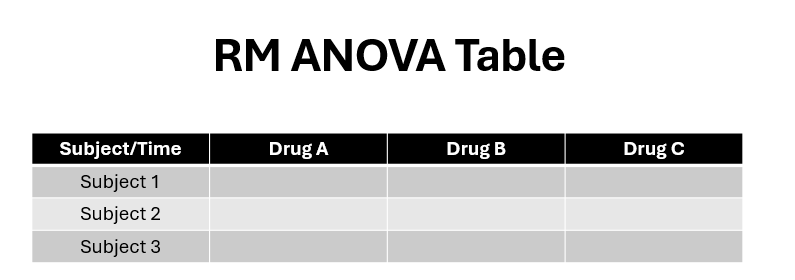
Crossover Design is specific type of repeated measures design — which outrightly models sequence and time period as factors in the ANOVA model. Remember when we learnt about repeated measures ANOVA in HP2100 — say we are now interested in comparing the effect of various pharmaceutical drug in increasing happiness levels. The ANOVA table would then look like this:

Side note: each measurement (cell) represents how much a person’s happiness levels increased before vs 30 mins after the medication
This is a One-Way RM ANOVA Design. Familiar right? But wait. Remember when we talked about RM Designs, one of the major problems was about order effects. What if actually, drug A is the super effective one — and after drug A my happiness levels are just perpetually sky high? If this is the case and I take drug A first — then drugs B & C will naturally seem to have no effect on me — even though they might actually also be equally effective!
Typically — we counter this upstream in the research design — by counterbalancing/allowing a large enough time gap between drug administrations such that any carryover effects can be assumed to be insignificant.
But what if we want to explicitly model the order and period effects in our ANOVA?
From One Way Repeated Measures ANOVA to Crossover Design
This is where it gets a little more complex. Remember when we say One Way Within Subjects ANOVA — we mean that there is one factor of interest (Drug Type) — but inside our ANOVA table we actually have 2? (Subject factor which is not interpreted). The Crossover Design nomenclature is slightly different from this.
Let’s go with a classic 2×2 Crossover Design first. The first number in this represents the number of levels of the treatment effect (main one, drug type in this case). The second number represents the number of time periods which were used in the study (typically, this number is the same as the number of levels of the treatment effect). Making a table of this:

Looks good thus far? Nope. The misleading thing about this table is that it just looks like a two way between subjects design. Crossover Design is a repeated measures design — thus we have to incorporate the subject factor as well. (which means that a 2×2 crossover design technically has 3 “factors”)
So, does a Crossover Design look like this?

Also no (obviously). The whole point of having different periods is so as to ensure that there are no carryover effects — by administering both drugs in one period, you are just shooting yourself in the foot!
This is actually a full two-way repeated measures ANOVA though — whereby the subject factor is completely crossed with the period x drug factor (a single subject undergoes ALL possible combinations).
An actual Crossover Design actually looks more like this:

And with this, you can see that the sequence in which subjects take the drugs is also different — can this can be explicitly modelled in the ANOVA.
Fun fact: this is also why the method is termed “crossover” — one group of subjects go from Drug A to Drug B — whereas the other group goes from Drug B to Drug A — mimicing a cross.

Key Tips to Understanding Crossover Design
Confused? You should be. Even I still get this wrong (lol).
To truly understand the Crossover Deisgn: you have to appreciate a few things:
- There are 4“factors” here — Drug, Time Period, Subject, Sequence
- Sequence is a between subjects factor
- Drug & Time period are within subject factors
- Drug is fully crossed with Time Period
- Subject is NOT fully crossed with Drug x Time Period
One of the major confusions I had about Crossover Designs was that the definition of a “factor” was not clear. Truth is, in a 2×2 crossover design — there is technically only 1 main factor we are interested in (Drug Type!) Yet when you add in other sources of variance to partition it out (things like time period, sequence, subjects) — whether or not you call these things “factors” is very unclear.
Side note: this problem was present even in our one-way RM ANOVA already — most online resources don’t call the subject effect a “factor” — even though that’s what we are taught in Psychology!
It is not my intention to debate about this though — it’s just that when you understand this, then you are in a much better position to understand why what you learnt seems so different from other online resources, and then be in a much better position to pick up where you left off from Psychology.
Crossover Design as a Specific Type of Split Plot Design
As mentioned previously — the main goal of us modelling the time period, sequence, and subject factors isn’t really because we are interested in them. Instead, we explicity model them just to remove their variance — so that our analysis has more power.
So how do we model them? Drumroll….. with Split Plot Design!
Shocked? Indeed — I was to when I saw the connection between them!
Crossover Design can be viewed as a specific type of Split Plot Design whereby:
- The between subjects factor is the Sequence (indeed, no participant undergoes more than 1 sequence) & Subject (though we definitely didn’t term this a “factor” last time)
- The within subject factors are Drug Type & Period
The full ANOVA table looks like this:

Notice that it looks really like a split plot design? With 2 error terms, and to analyse the effect you want — you have to look for the correct denominator term?
After you make this conceptual connection — everything becomes much clearer.
Crossover Design in Software
Unfortunately —crossover design is not directly supported inside either SPSS or Jamovi (primarily because you now have multiple within subject factors — and GUIs weren’t designed for this). You have to turn to R for this.
You data needs to be in long format — looking something like this.

The code is as follows:
# =========================
# 2x2 Crossover ANOVA
# =========================
# 1️⃣ Create long-format dataset
df <- data.frame(
  Subject   = factor(rep(1:6, each=2)),  # 6 subjects, 2 rows each
  Sequence  = factor(c('AB','AB','AB','AB','BA','BA','BA','BA','AB','AB','BA','BA')), # subject sequence
  Period    = factor(rep(1:2, 6)),       # Period 1 or 2
  Treatment = factor(c('A','B','A','B','B','A','B','A','A','B','B','A')), # Treatment received
  Outcome   = c(5,3,6,4,4,5,3,2,7,6,5,4) # Measured outcome
)
model <- aov(Outcome ~ Sequence + Period + Treatment + Error(Subject/Period), data=df)
summary(model)
If you notice, the syntax is as follows: Outcome is predicted by Sequence, Period, and Treatment (you do not need to specify “subject” as a “predictor”). Because the aov module automatically only uses 1 error term (subjects)— to reflect the fact that you have within subject variables, you need to specify the within subjects error term via error(subject/period).
The output would then look like that:

Extension — Interaction Terms
The sharper of you people would ask— where did my interaction terms go!
Indeed — given that you have multiple “predictors”, you can technically analyse interaction effects as well. The most commonly one estimated is the drug x time period interaction (any interaction effect involving subject is not feasible — given that there will be missing values).
Honesltly, I also wonder about the sequence/drug and sequence/time period interactions. Apparently it has something to do with orthogonality as well though (I must admit this is new to me as well) — thus these interactions are actually zero.
Despite so — at the end of the day — you need to remember that only drug is your true predictor. The rest you actually want them to be insignificant in order to safely parse out their effects. As a result, main effects usually suffice here.
Conclusion
Man — this is probably one of the hardest posts I wrote in the entire time I spent creating this Psychology Statistics Resource Hub — partially because I myself had to relearn the content basically afresh in order to blog about it. What a journey it has been! Fundamentally — a huge part of me does enjoy learning about statistics too — which explains how I am able to still keep up with my blogging in spite of numerous other responsibilites in my life.
We have officially come to the end of HP3101! I honestly thought HP3101 would be taught in this semester — which was why I blogged about it first — but turns out it was HP3804 that got offered instead (oops). Feels bad to those who were waiting for my HP3804 content — I probably won’t finish it this sem! Hahahaha
For future students reading this: please know how fortunate you are 😆
Onwards to HP3804 (Psychological Testing)!
Learn more about HP3101 NTU Psychology Statistics: Module Review (Crossover Design)