Note: this post is part of a series of posts regarding HP3804 (Psychological Testing)
What is Reliability? Again—a seemingly innocent and simple question that you think you know the answer to from HP1100. (Spoiler alert: no, you do not HAH)
Where does “Reliability” Occur?
As mentioned in the previous post — each measurement scale should only measure one thing at a time. It then follows that reliability should also only be interpreted with respect to unidimensional constructs — because the entire concept of reliability rests on the premise that you are quantifying how consistently you are measuring the same thing over multiple times.
Reliability, also, occurs only when there is measurement. Reliability is a property of the measurement scale — NOT of the construct. Some people get confused about this — but it is important to distinguish it properly because getting this wrong makes you look silly (lol). If you say “what is the reliability of extroversion?” — people immediately know that you are amateur because you don’t really understand what reliability is. There’s no such thing as reliability of a construct — there’s only reliability of a scale measuring a construct!
Which also naturally implies that the same construct can “have” multiple reliability scores — because there can be multiple scales measuring the same construct. Indeed — extroversion itself has many scales — from the Colgate Personality Inventory, Big Five Inventory, Eysneck Personality Inventory — all of these measure extroversion. They may differ in the domains of extroversion they capture, their response formats (likert scale/yes or no), the number of questions etc — but all of them are valid.
Which leads us to another problem — with so many possible scales — how do you know which one is good?
Reliability as a Metric of a Good Scale
Relaibility is one of the ways that we argue that a scale is good (the other is Validity, which I will talk about in a separate post). Reliability can be understood as consistency — the extent to which questions on the scale give you the same result.
Reliability is tricky however — in that the specific form of consistency that you capture can vary a lot. Some people choose test-retest reliability — which describes the extent to which participants scores are correlated with each other should they retake the test again. A sample dataset would look like this:

Importantly, for a scale to be reliable, the score on Day 1 should be highly correlated with the score on Day 30 (i.e a participant measured to be high in extroversion on Day 1 should also be measured to be high in extroversion on Day 30. If high in Day 1 but low in Day 30 — somehting is wrong!).
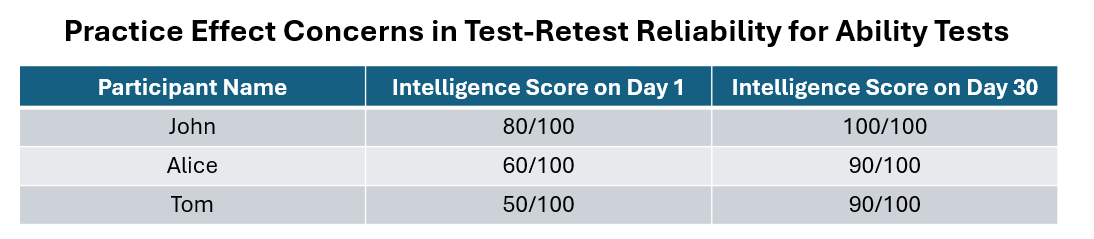
But this form of reliability involves asking participants to take the same test twice (hence test-retest!). For measurement scales which do not have right/wrong answers (attitude tests), this is still fine. But what if you are measuring ability — whereby questions have a right and wrong option? Your scores will then look like that:

because of the dreaded practice effects (people do better at test papers they have seen before!) For ability tests, should you choose test-retest reliability, you will need to have different sets of the same test that are equivalent (which again is a whole other thing to prove) — and then ask participants to take different versions of this “same test” in order to avoid practice effects. How tedious!
Side note: you would probably have seen this “different versions of the same test” somewhere before in your education journey — whereby different students receive different test papers (A,B,C typically). The idea is simple — you can do equivalence testing between the test scores for the different tests afterward to see if test type influenced the test scores unfairly! If they did — hahaha you might have to adjust some scores to make it fair to unlucky students who got the harder test
Which is why some forms of reliability are preferred over others for certain types of tests— no wrong, no right here. All the various forms of relaibility are valid — so as long as what you are doing makes sense, you’ll be alright.
Any Shortcut to Reliability?
As I’ve hinted at earlier — test retest reliability is a hassle. Instead of test-retest reliability, researchers wanted to find some easier way to establish reliability. As a result, they came up with this idea of split-half reliability — whereby instead of taking the same test twice, since all questions in the test are measures of the same unidimensional construct — each half of the test can be used as “a test” — and thus reliability can be examined by correlating scores from one half of a test to another half. Brillant, right? 😉
But wait. This obviously only makes sense if you have enough questions to split into half and still have have half be substantial enough to correlate with the other half. How many questions is good enough? Again, no hard and fast rule unfortunately (you will realise that Psych Testing is a lot less concrete than the other statistical modules — in that almost everything feels like there’s no correct answer. It’s more of whether your decisions are justifiable or not!)
Number of questions aside — split half reliability faces another problem. How to split? If we have 20 questions in the test, we theoretically have (20C10)/2 = 92,378 possible ways to split the test into halves!
If we don’t use the theorectical route and instead split the questions by convenience — we face yet another problem. Usually, people will simplistically think to just split the test into 1st half of questions (questions 1–10), and 2nd half of questions (questions 11–20) to examine split half reliability. But this method is flawed becasues questions in a question paper are often not all equal. Usually, in order to help with student’s self esteem (lol), easy questions are placed at the front. Technically there’s nothing statistically wrong with putting the most difficult questions right at the start to kill (ahem, test) students on their understanding of a subject matter. But this is not the way things are usually done!
So if you use convenience splitting and split the paper into 1st half and 2nd half to correlate, your correlation is going to be very low because people are obviously going to score a lot worse on the 2nd half of the test compared to the 1st. Difference in scores = low correlation between halves = low reliability = your exam paper is lousy! So you better be careful about how you split!
Usually, a more robust method would be to do an odd-even split — whereby odd number questions go in one groups, while even number goes into the other group. This solves the “difficult questions at end problem”, but is fundamentally still a convenience method — there’s no theoretical basis to it, and splitting it in any other way would generate a different split half reliability.
Cronbach Alpha as the Average of all Split-Half Reliabilities
If any particular splitting method is going to be attacked — what can we do? Aiya, just do all loh! That is essentially what Cronbach Alpha is — the average of all possible split half reliabilities. Cronbach Alpha is the most commonly used metric of reliability in fact, and you will often see this alpha value reported in almost all research papers that utilise a scale.
Unfortunately, Cronbach alpha is also one of the most wrongly used metrics in the entire field of Psychology. People often chase arbitrary thresholds like “my alpha must be greater than 0.7” — not really knowing why or how this number of generated in the first place. The Cronbach Alpha formula is as follows:

Inter-item correlation — r — is new here. You can think of r as a “form” of reliability in the first place— it represents the average correlation of an item with all other items in the test (correlate an item with every other item’s scores, get average correlation). Each item will thus have an “r” value — and this r value is often used to see if any items in the test are measuring a different thing from the rest of the items as a whole (low r values should be avoided). The average of all of these item level r values gives r bar which we see in the formula — known as average inter-item correlation.
Which is intuitively why Cronbach alpha works — it is a measure of how every item in the test is consistent with other items in the test! Statisticians managed to prove that the formula is equivalent to the average of all possible split-half reliabilities eventually — I shall not delve into the proof here, but just take my word for it for now (hahaha).
But I digress. I showed you the formula primarily to elaborate about why Cronbach alpha is wrongly used in the literature — and that is because you will notice that Cronbach alpha is a function of N — number of items — as well. N in the numerator increases faster than N-1 in the denominator — meaning that Cronbach’s alpha will increase as test length increases.
This is what people often forget! A longer test will automatically have a “higher reliability” by Cronbach alpha — even if it has the same inter-item correlation (meaning that the extent to which items are measuring the same thing is technically the same). So if you want to artificially inflate your reliability, just increase the number of questions you have! (oops)
Conclusion
Reliability is more complicated than you think — isn’t it? From chasing a random 0.7 for “good reliability” in your previous projects — you now have a better idea of what this 0.7 actually is, and why blindly chasing it may not actually be a good thing.
Which brings me to a recurrent theme in this module actually — how the chasing of these arbitrary thresholds is actaully counter-productive. p = 0.05 is an example of such a threshold (which is why people resort to p-hacking). Truth is, these thresholds are fundamentally arbitrary — they have no intrinsic value to them. Yet, people who don’t understand statistics well take them as golden truths — forcing their results to conform to these thresholds in order to get “positive results”. In truth, in your results, if you know how these numbers are generated you can always instead argue that due to certain intricacies in your methodology (shorter test for instance) — the threshold does not apply strictly and thus your results can still be classified as “positive”. Indeed — what I learnt from this module is that your argument is more important than your actual results — all of the “objective thresholds” are actually not that “objective” afterall!
And with that — we can move on to the next important concept after reliabilty — validity. Keeping in mind that “validity thresholds” are a thing as well, let’s see if you can apply what you learn here to the next lecture!
Learn more about HP3804 NTU Psychology Statistics: Module Review (Reliability of a Scale)