
r/dataisbeautiful (the snobs):
"Technically 1.5 years between announcements. iPhone 1 was announced Jan 2007, released June 2007, and the 3G was released July 2008."
"It's technically impressive but it's very early stages for this type of thing and you shouldn't confuse progress with perfection."
r/technology (the cynics):
"Which is fucking grim – can you endure four years of no pay and 'investing' in yourself that will fuck you over for more than a decade? Great! Then we know that you'll be a perfect wage slave for us!"
r/ChatGPT (the enthusiasts):
"It would take a comedy writer like an hour to write that. That is amazing for taking a few seconds"
r/Futurology (the anxious):
"You feed it the facts and tell it how you want it formatted. It spits out the text. Feed it an outline in bullets and it spits out a white paper."
Methodology
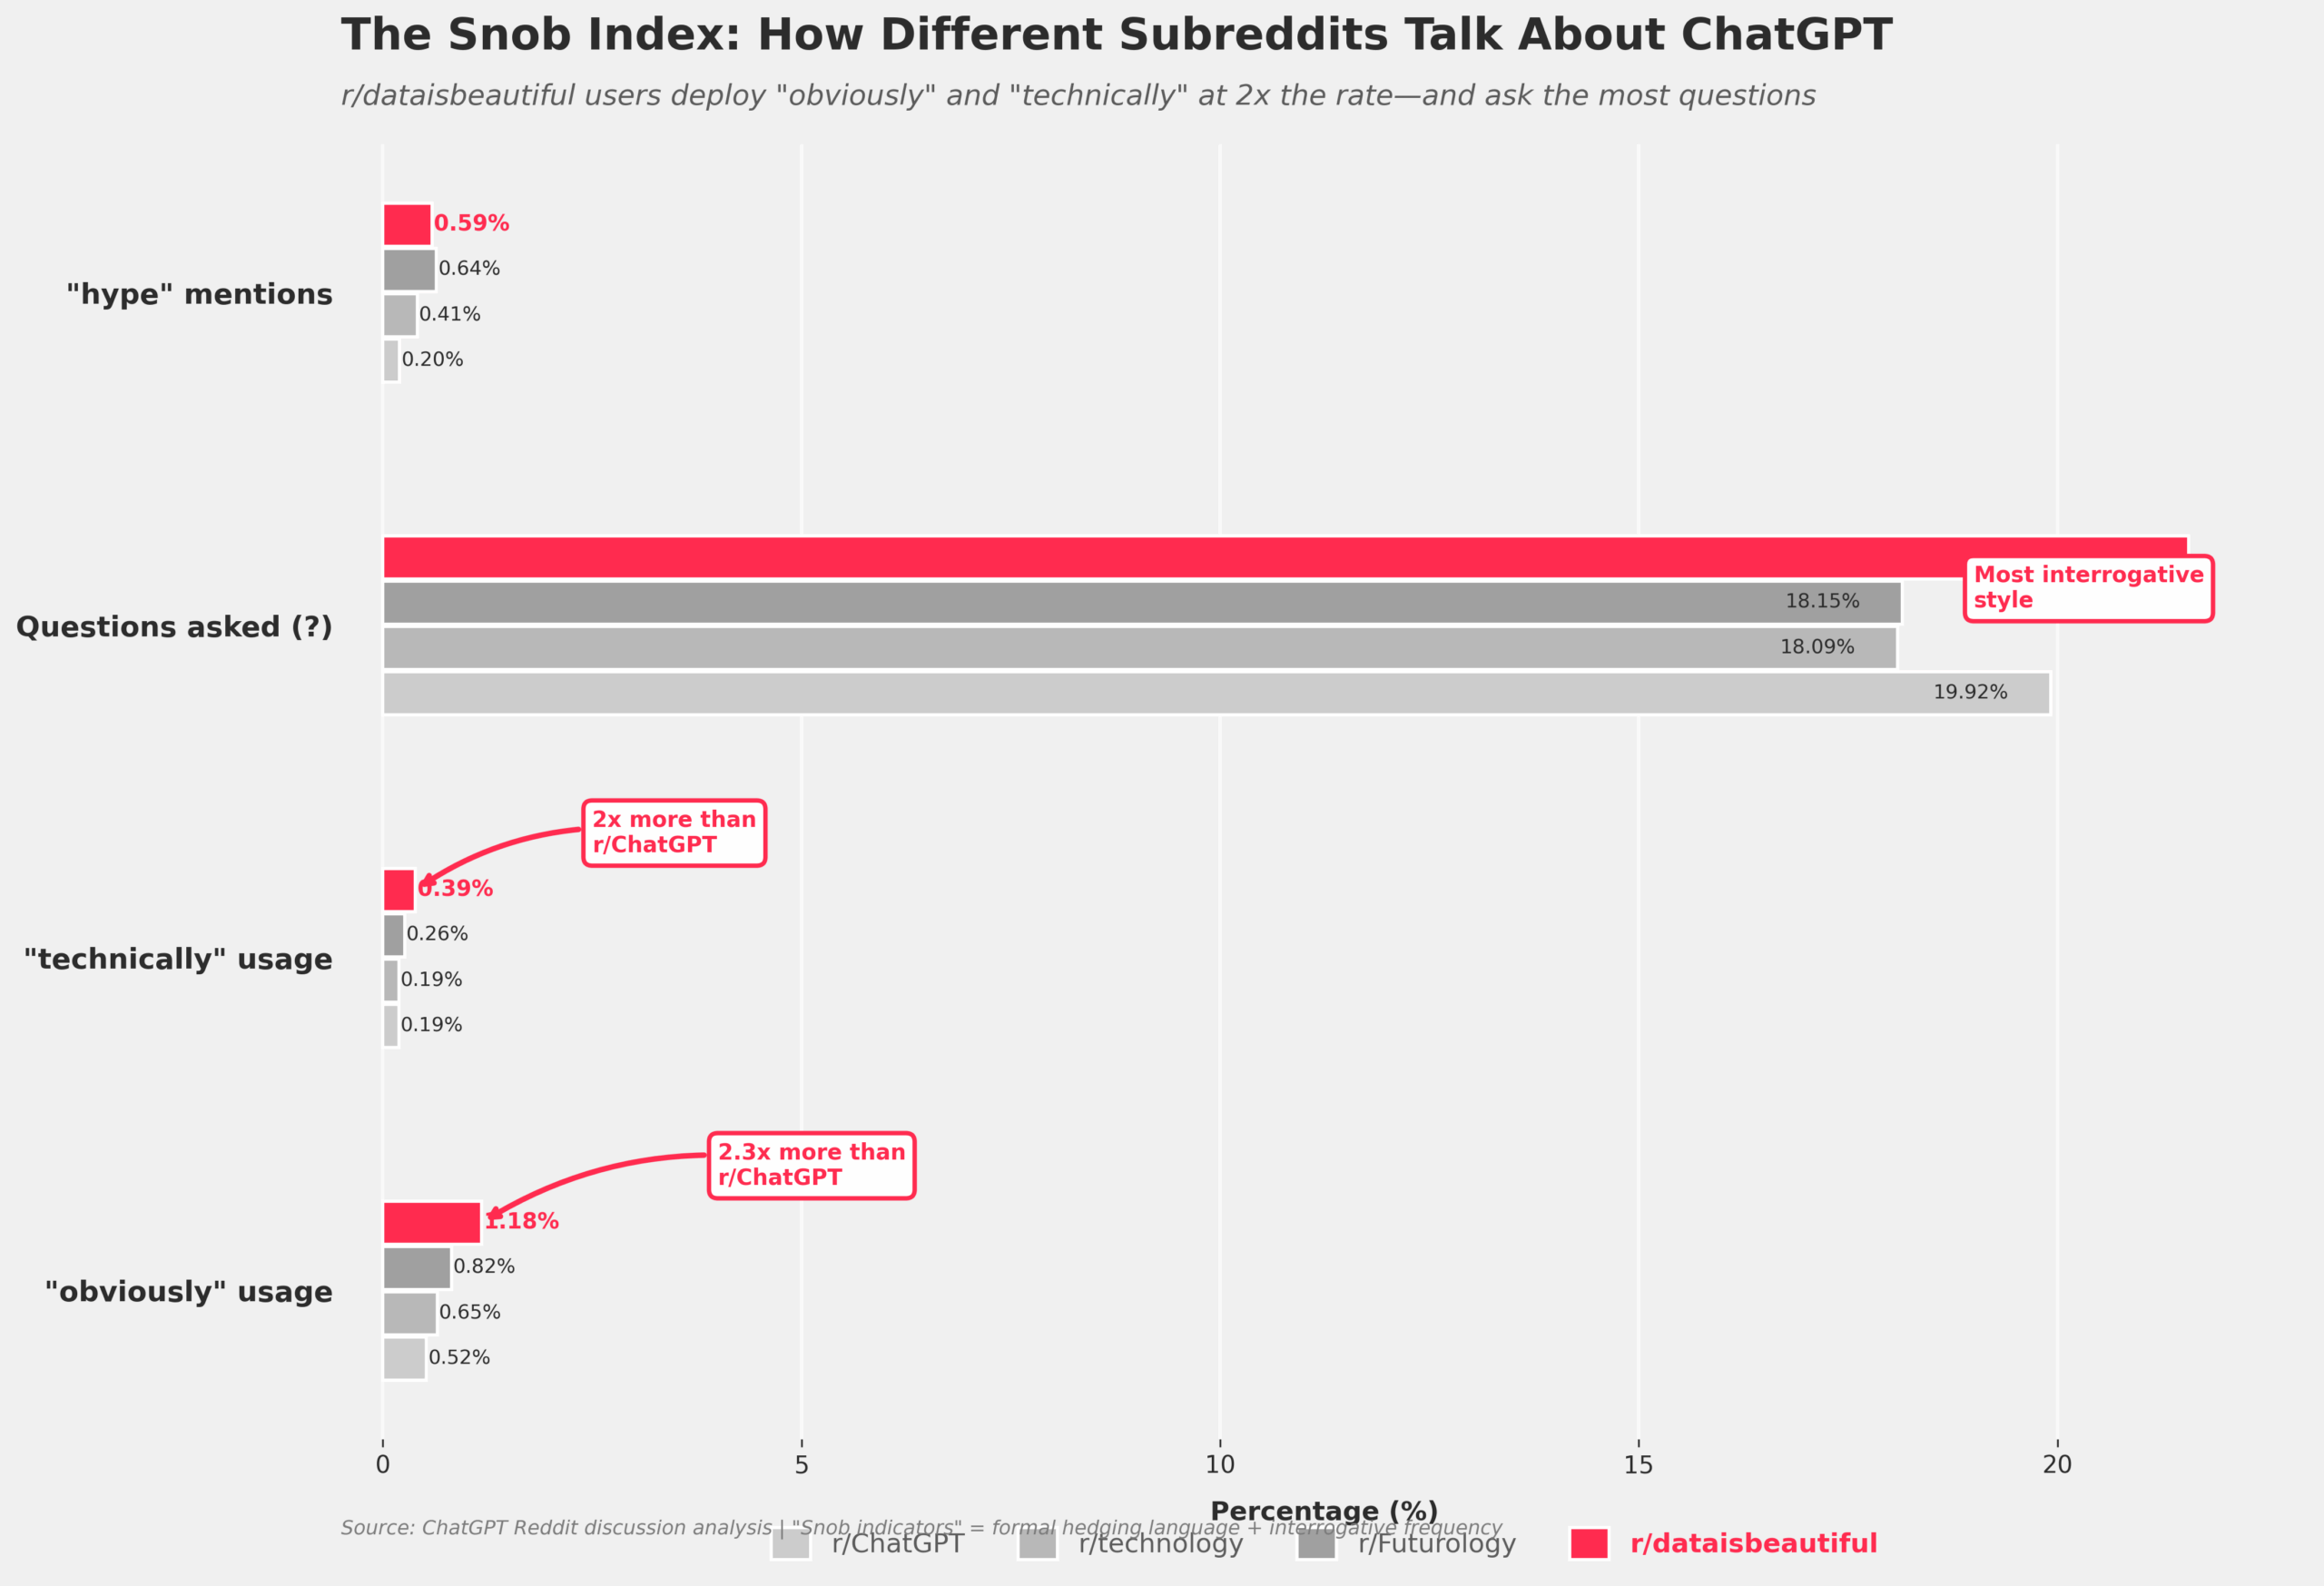
* Dataset: 52,416 comments from Kaggle's ChatGPT Reddit dataset
* Subreddits: r/ChatGPT (29,711), r/technology (16,672), r/Futurology (5,009), r/dataisbeautiful (1,020)
* Analysis: Keyword frequency analysis using SQL pattern matching
* Visualization: Plotly (interactive) + Matplotlib (static)
The "snob index" is obviously (see what I did there?) a simplification. Word frequency ≠ intent. But the patterns are consistent enough to be meaningful.
TL;DR
* r/dataisbeautiful is 2.3x snobbier (by "obviously" usage)
* r/Futurology is 3.5x more terrified about job replacement
* r/technology swears the most
* r/ChatGPT is just vibing
Extras:
– https://sagecdn.flowstack.fun/t_6fe54402be43/ws_1765570233_f6f1bf4d/visualizations/subreddit_radar.html
– https://sagecdn.flowstack.fun/t_6fe54402be43/ws_1765570233_f6f1bf4d/visualizations/sentiment_heatmap.html