The Keltner Channel Indicator is a powerful tool for technical analysis, aiding traders in identifying trends, breakouts, and strategic entry and exit points.
💎source:
https://tradingfinder.com/products/indicators/mt5/keltner-channel-free-download/
💎free indicator download:
https://cdn.tradingfinder.com/file/116391/keltner-channel-mt5-by-tflab.zip
By combining an Exponential Moving Average (EMA) with the Average True Range (ATR), this indicator dynamically adapts to market volatility.

Key Features of the Keltner Channel Indicator
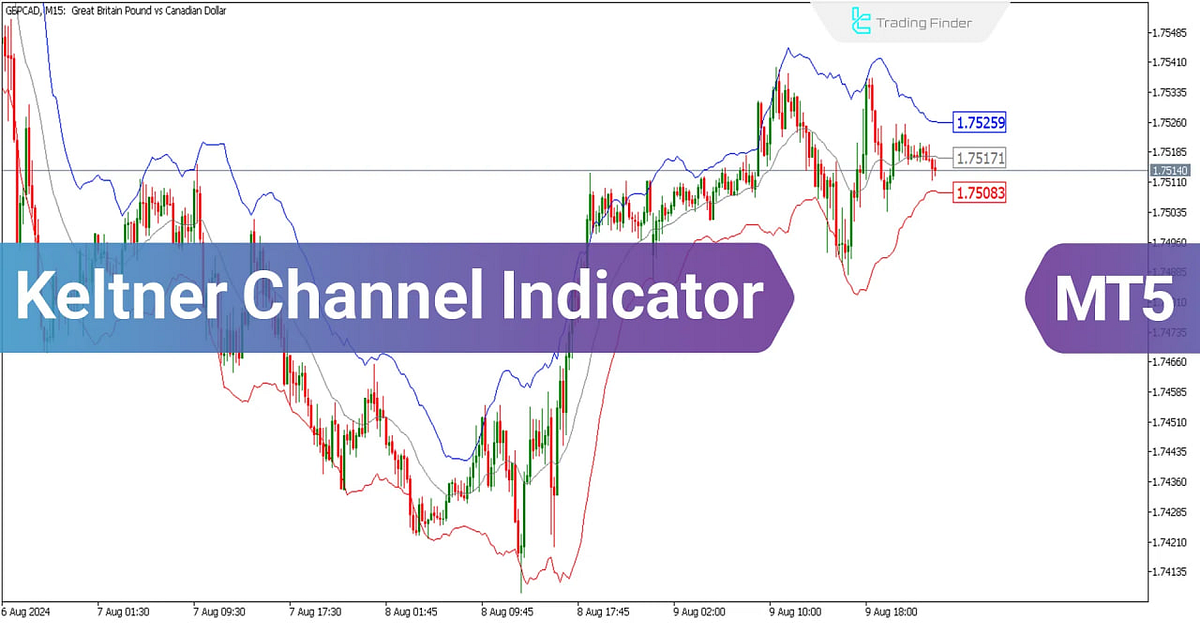
- Dynamic Channel Bands:
- Middle Line: An EMA that represents the average price over a specified period.
- Upper Band: Determined by adding a multiple of the ATR to the EMA.
- Lower Band: Calculated by subtracting a multiple of the ATR from the EMA.
- Volatility Measurement:
- Adjusts channel width according to ATR, expanding during high volatility and contracting when volatility decreases.
- Trend Identification:
- Helps in recognizing uptrends, downtrends, and sideways markets based on price movement relative to the channel bands.

Trading Strategies Using the Keltner Channel Indicator
- Breakout Signals:
- A price move above the upper band signals a potential bullish breakout (buy opportunity).
- A price move below the lower band indicates a possible bearish breakout (sell opportunity).
- Squeeze Patterns:
- When the channel bands contract, it signifies low volatility and often precedes significant price movements, making it useful for predicting potential breakouts.
Indicator Settings

Adjusting these settings allows traders to customize the indicator based on different timeframes and trading styles.
Download and Installation
The Keltner Channel Indicator is available for MetaTrader 5 users. Follow these steps to install it:
- Download: Get the indicator file.
- Install: Move the file into the ‘Indicators’ folder of the MetaTrader 5 directory.
- Activate: Restart MetaTrader 5 and add the Keltner Channel Indicator to your chart from the ‘Navigator’ panel.
Consultation & Trading Tips
For effective use of the Keltner Channel Indicator:
- Combine with Other Indicators: Use with RSI or MACD to confirm trade signals.
- Set Stop-Loss Properly: Place stop-loss orders outside the channel bands to manage risk effectively.
- Test on Demo Accounts: Before using in live markets, practice in a demo environment to refine strategies.
FAQs
❓ What is the best timeframe for using the Keltner Channel Indicator?
It can be used on multiple timeframes. Short-term traders prefer 5-minute or 15-minute charts, while long-term traders use daily or weekly charts.
❓ Can the Keltner Channel be used for all asset classes?
Yes, it is applicable to forex, stocks, commodities, and cryptocurrencies.
❓ How does it differ from Bollinger Bands?
The Keltner Channel uses ATR for calculating band width, while Bollinger Bands use standard deviation.
❓What market conditions work best with this indicator?
It is effective in trending markets for identifying breakouts and in ranging markets for spotting reversals. By incorporating the Keltner Channel Indicator into your trading strategy, you can enhance decision-making and improve market analysis accuracy.
Learn more Keltner Channel Indicator for MetaTrader 5 — Free Download