Study subjects
This study analyzed data from a single regional comprehensive stroke center registry of consecutive patients with acute ischemic stroke. This registry is part of the Clinical Research Collaboration for Stroke-Korea (CRCS-K) registry16,17. A total of 8,136 patients with ischemic symptoms who were admitted to our tertiary stroke center between January 2011 and July 2018 were initially screened. We included patients with ischemic stroke within 7 days of onset. The detailed eligibility criteria and patient selection flow chart are shown in Supplemental Fig. 1.

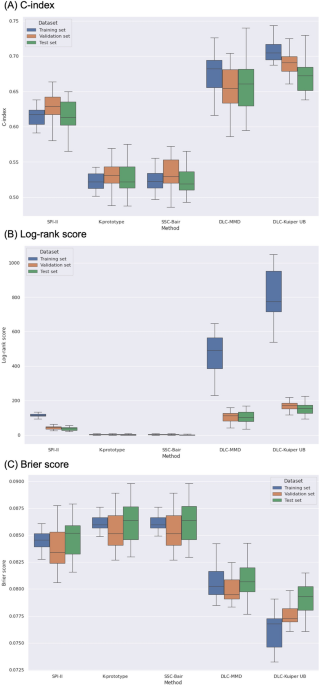
C-index (A), log-rank score (B), and Brier score (C) for different clustering methods applied to the datasets.
Ethics statement
Clinical information was obtained from the registry database. The registry has been collecting clinical information for the purpose of monitoring and improving the quality of stroke care since 2011, with the approval of the institutional review boards of our hospital. The use of the registry database and the supplemental review of medical records in this study were approved by the institutional review boards. A waiver for informed consent was provided because of study subject anonymity and minimal risk to the participants by an institutional review board at Chonnam National University Hospital. All the methods were performed in accordance with the relevant guidelines and regulations (Declaration of Helsinki). The corresponding author will provide the data, analytical methods, and study materials to other researchers upon reasonable request. Additionally, the GitHub website address for the DLC method is as follows: (https://github.com/PurdueMINDS/DeepLifetimeClustering).
Data collection
Data were prospectively collected and included demographic, clinical, imaging and laboratory data. Data collection is described in the Supplemental Methods. For continuous variables, if fewer than 3% of the values were missing, the data were imputed with the median values or as the mode.
Outcomes
The primary outcome was a composite of all types of recurrent stroke (ischemic and hemorrhagic), myocardial infarction, and all-cause mortality within one year after the index stroke. Secondary outcomes consisted of the following individual events: (1) all types of recurrent stroke (ischemic and hemorrhagic) and (2) all-cause mortality. As previously described17, vascular events were prospectively captured during hospitalization and the 3-month and 1-year follow-up periods by dedicated stroke nurses or physicians based on predefined protocols at routine clinic visits or during telephone interviews. To ensure the accuracy of the outcomes and to minimize inter-interviewer discrepancies, a uniformly structured questionnaire was used by trained personnel17.
Clustering models
The clustering method is a type of unsupervised learning that consists of similar characteristics within a group and different characteristics between groups through the characteristics of individuals. This means that there are no actual labels, but clustering gives each object a new label (a risk-based cluster in the study). The criteria for dividing the degree of risk for the generated clusters are the Kaplan–Meier curve.
As a reference in stroke patient clustering, the SPI-II scores were used. The SPI-II scores were retrospectively calculated as the sum score (0–15 points) of 7 clinical factors based on their predictive significance: congestive heart failure (3 points), diabetes mellitus (3 points), prior stroke (3 points), age > 70 years (2 points), stroke as the index event (2 points), severe hypertension (1 point), and coronary artery disease (1 point)5. To investigate the risk of 1-year vascular events, the SPI-II scores were categorized into 3 groups based on previous studies: low risk (0–3), medium risk (4–7), and high risk (> 8).
K-prototype
K-means clustering is a representative clustering method that assigns a given datapoint to preset k clusters. The cluster is updated until no further cluster changes occur in the direction of minimizing the sum of squares of the center of each cluster and the distance between objects. However, K-means clustering can be used in continuous data. The method used for categorical data is called k-mode clustering, which replaces the means of clusters with modes. K-prototypes is a clustering method that combines K-means and K-modes methods for use in a mixture of continuous and categorical data12.
SSC-Bair
SSC-Bair is a clustering model that groups using K-means by selecting covariates that affect the hazard ratio through Cox models13.
DLC model
DLC proceeds with survival clustering to utilize neural networks to optimize differences between empirical lifetimes. Neural networks are learned through covariates of observations, and the final layer of neural networks is allocated to one of the k-clusters through softmax layers. The empirical lifetime distribution is obtained from the Kaplan–Meier estimator using the assigned clusters, and the model is trained to maximize the difference in the survival distribution of the clusters. Because DLC does not assume a proportional risk, it can cross a lifetime curve. The objective function of the DLC model is as follows:
$$W_{1}^{*} , W_{2}^{*} = \mathop {{\text{argmax}}}\limits_{{W_{1} ,W_{2} }} \mathop {\min }\limits_{{i,j \in \left\{ {1 \ldots K} \right\}, i \ne j}} {\Delta }\left( {\hat{S}_{i} ,\hat{S}_{j} } \right)$$
\(\hat{S}\) is an empirical distribution, and ∆ is the divergence measure. However, because datasets have information concerning the occurrence of events in this study, \(W_{2}\), indicates that a stochastic estimation of the terminating signal is not considered15.
Although many methods are available to measure divergence, sample sizes must be considered. The gradient calculation should be simple because it serves as an objective function of neural networks. Additionally, proportional hazards should not be assumed. We used and compared the Kuiper p-value upper bound (Kuiper UB) and maximum mean discrepancy (MMD) as divergence measures18,19.
Shapley Additive exPlanations (SHAP)
We applied the Shapley Additive ExPlanations (SHAP) method to verify the importance of variables for each cluster. SHAP is a unified framework for predictive interpretation20, which expresses the importance of variables by comparing predictions of situations with baseline values when there are certain values for a given feature.
Detailed instruction of applied models
The percentage of missing values for variables was less than 3%, the categorical variables were replaced by values that did not result in events, and the continuous variables were replaced by median values for nonmissing data. The analysis was conducted after preprocessing each method. Among the application methods, SPI-II scores distinguished each group by labeling divided by scores. For comparison with groups of SPI-II scores, the number of groups in other models was set to 3. SSC-Bair selected only variables with p-values less than 0.1 through the Cox model, classifying them into three clusters through k-means clustering. DLC is a neural network-based clustering model that used 30 characteristics in this study (Table 1). DLC included the patient’s gender and age as input, and information on whether an event occurs within a year of the patient and the time of event occurrence as a target. Continuous input variables were scaled using a minimax scaler, and categorical variables were analyzed as one-hot encoding. By optimizing the loss function that maximizes the difference in the empirical distribution of K (set to 3 in this study) clusters through input and target, weights are updated to allocate patients to three clusters considering the characteristics and lifetime distribution. Because the results differed according to the change in the hyperparameters, the final model was selected by the validation set after the experiment by changing the hyperparameters such as the number of layers, learning rate, and activation function (Supplemental Table 1). Using the final selection model, when a new patient occurs, the risk group of the patient can be presented by entering the patient’s characteristics. SHAP used DeepExplainer to perform the analysis among the Explorers provided by the library. In general, a dataset is divided into training, validation, and test sets. The training set is required for learning to generate a model, and the validation set is used to avoid overfitting of the learned model and determine appropriate hyperparameters. The pre-set hyperparameters (such as those shown in Supplementary Table 1 for the DLC model) are applied to the model learned in each combination. From these many candidate models, the model with the best performance based on the evaluation index is selected and used as the final model. The test set is used to evaluate the performance of the final model selected using the validation set. The training, validation, and test sets were divided 60:20:20 using stratified sampling based on the outcome rate to reduce bias.
Statistical methods
The data are reported as percentages, means (standard deviations), or medians (IQRs), depending on the variable characteristics. Categorical variables were analyzed using Pearson’s chi-squared test or Fisher’s exact test, and continuous variables were analyzed using analysis of variance or the Kruskal–Wallis test, as appropriate. The following parameters had missing data that were substituted using median values: BMI (2.2%), creatinine (0.2%), hemoglobin (0.1%), white blood cell count (0.1%), and initial random glucose (0.7%). The metrics used to evaluate the clusters obtained from the methods were the concordance index, Brier score, and Log-rank score test. The results of the metrics represented the mean and standard deviation in 30 iterations. In addition, we also conducted conventional statistical analyses for associations of each cluster with 1-year vascular outcomes according to the cluster methods in the study cohort. A p-value
Ethics approval
The current study was approved by the institutional review board at Chonnam National University Hospital.
Consent to participate
A waiver for informed consent was provided because of study subject anonymity and minimal risk to the participants by the institutional review board at Chonnam National University Hospital.