
"The Hindenburg Omen is a combination of technical signals that together forecast the likelihood of a stock market crash. The technical inputs are the 10 Week Simple Moving Average, New 52 week highs on the NYSE, New 52 Week lows on the NYSE, and the McClellan Oscillator.
If, on the same day,
a) the 10 Week Moving Average is rising,
b) New Highs and New Lows are greater than [2.2]% of total issues traded,
c) the McClellan Oscillator is negative, and
d) New Highs are less than or equal to twice the New Lows
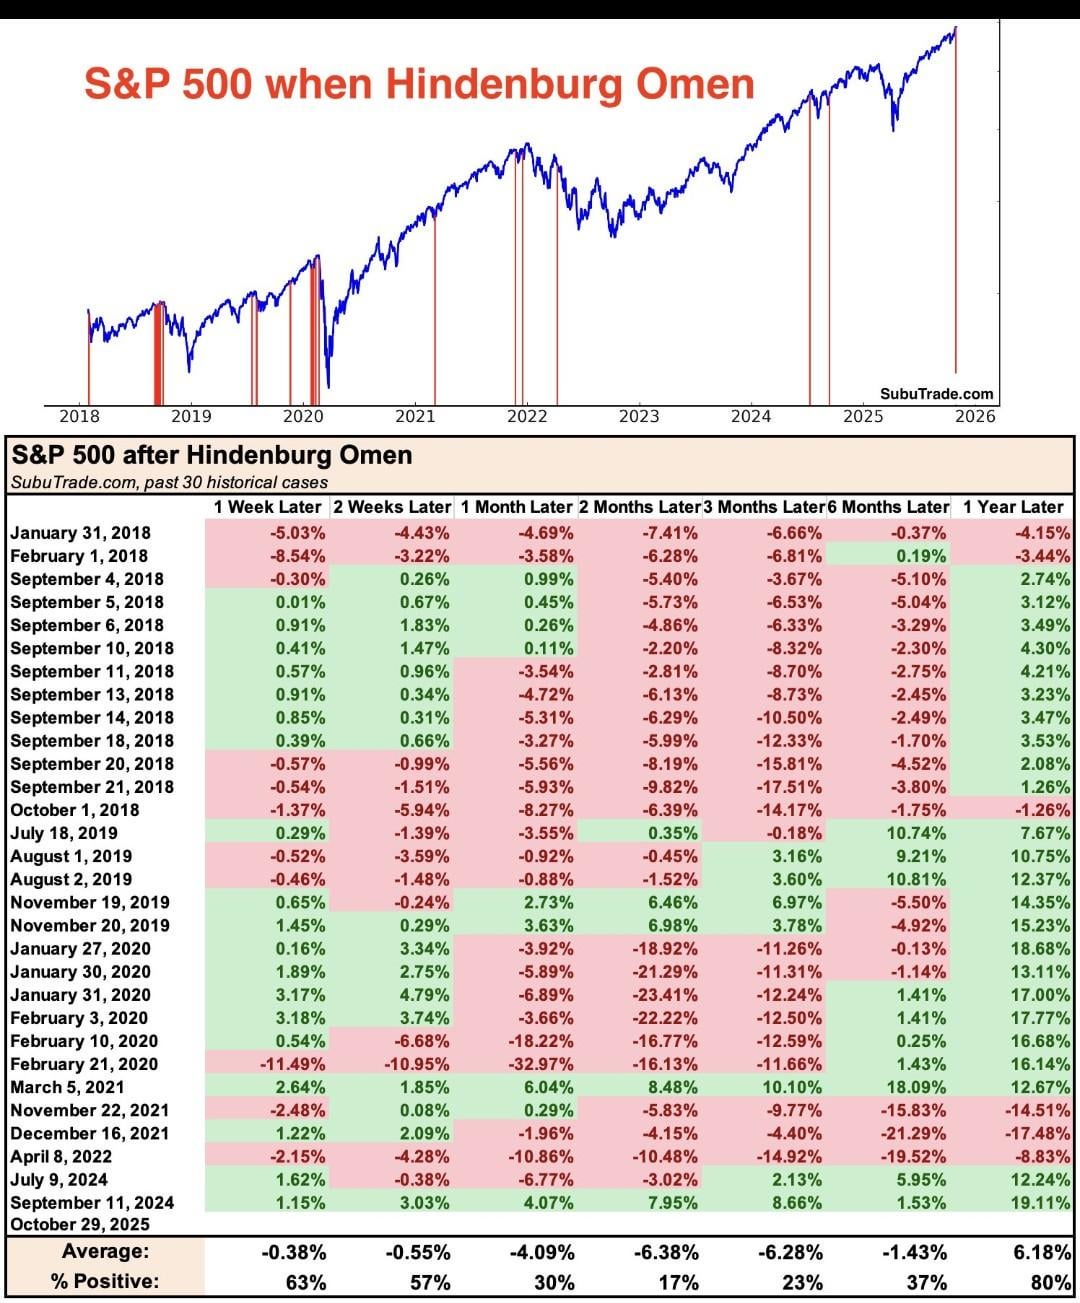
then a Hindenburg Signal is indicated by a yellow circle.
Two such signals within a 36-day period is considered a Hindenburg Omen and is indicated by a red diamond. The Hindenburg Omen portends a serious decline within the next 40 days."
I’m genuinely curious what others think about this one. Does this signal actually carry weight in today’s algo-driven, liquidity-fueled market, or is it just another outdated technical anomaly? Could this be an early red flag we shouldn’t ignore, or simply noise in an overextended market?